
Rocío García-Retamero (a,b) y Dafina Petrova (a)
(a) Mind, Brain, and Behavior Research Center, University of Granada, Spain
(b) Max Planck Institute for Human Development, Germany

(cc) Allan Donque.
Transparent risk communication is an essential component of informed decision making. Unfortunately, many people struggle to understand risks because they lack practical mathematical and risk literacy skills. Our research shows that well-designed visual aids improve risk understanding by encouraging more thorough deliberation and reducing biased risk representations.
Numerical skills are essential for navigating the modern health care environment. Unfortunately, many people lack basic numeracy, which limits their ability to accurately interpret risks (i.e., risk literacy; see https://www.riskliteracy.org). One study with probabilistic national (i.e., representative) samples in the United States and Germany showed that 25% of the residents in both countries did not know which of the following numbers represented the greatest risk of disease: 1 in 10, 1 in 100, or 1 in 1000 (Galesic & Garcia-Retamero, 2010). A follow-up study showed that patients seeking treatment were even less numerate: More than 40% could not accurately interpret basic information on risk of disease (Rodríguez et al., 2013).
Health professionals also struggle to interpret health-relevant numerical expressions. In one study of surgeons from 60 countries, we found that 40% could not correctly interpret results from a randomized controlled trial examining the risk of a post-surgical side effect (Garcia-Retamero, Cokely, Wicki, & Joeris, in press). Similarly, a study conducted on gynecologists showed that one third of the sample did not understand the meaning of “a 25% reduction of breast cancer mortality by mammography screening” (Gigerenzer, Gaissmaier, Kurz-Milcke, Schwartz, & Woloshin, 2007). Among that third, most believed that screening protected 250 women out of every 1000 when the correct answer was in fact 1 in 1000. Why did such confusion occur?
Numerical information can be reported using different information formats. To illustrate, in the study reported above, gynecologists received numbers presented as a relative risk (i.e., 25%). The same results can also be presented as an absolute risk: Without screening, 4 out of 1000 women would die of breast cancer. With screening, 3 out of 1000 women would die of breast cancer. This means that out of 1000 women participating in screening, 1 woman would be saved. Dividing the number of women saved by the screening (1) by the number of women who died without screening (4) gives us a relative risk reduction of 25%, reported in the study. As the reader might see, relative risks appear much larger than absolute risks.
Good decision making is possible when risks are represented in formats that naturally fit people’s abilities and decision-making strategies. This is how transparent information formats (simple but well-designed visual aids) improve high-stakes decision making of health professionals and patients alike (Garcia-Retamero & Cokely, 2014; see Figures 1 to 7, for some examples, all adapted from Garcia-Retamero y Cokely, 2013).
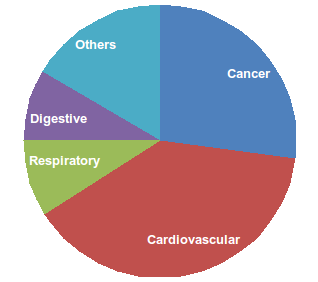
Figure 1.- A pie chart reports the proportion of deaths by cause of death.
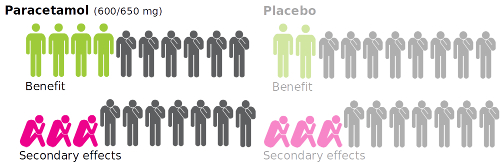
Figure 2.- Icon arrays represent benefits and side effects of a medical treatment and a placebo.
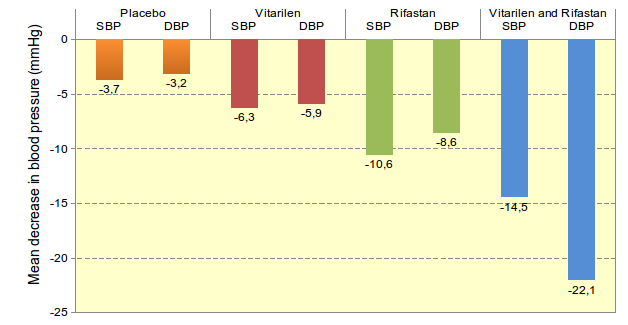
Figure 3.- A bar chart compares the efficacy of two medical treatments on systolic (SBP) and diastolic (DBP) blood pressure.
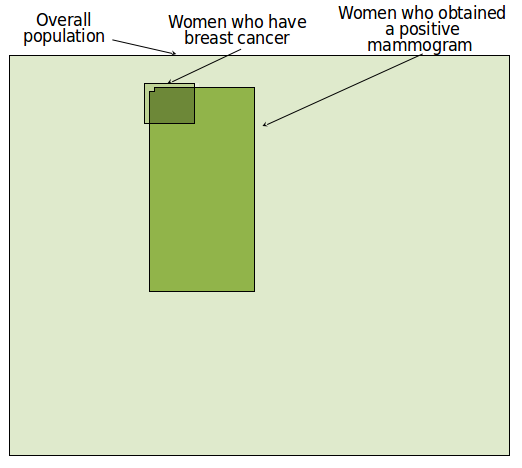
Figure 4.- A visual grid is used to help infer the predictive value of mammography screening.
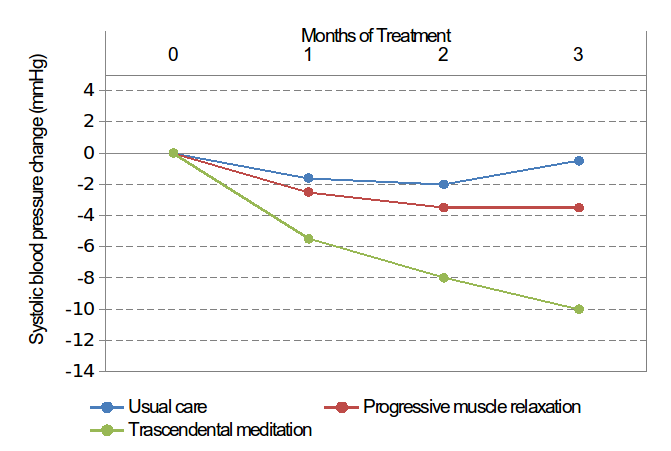
Figure 5.- A line plot compares the efficacy of several therapies.
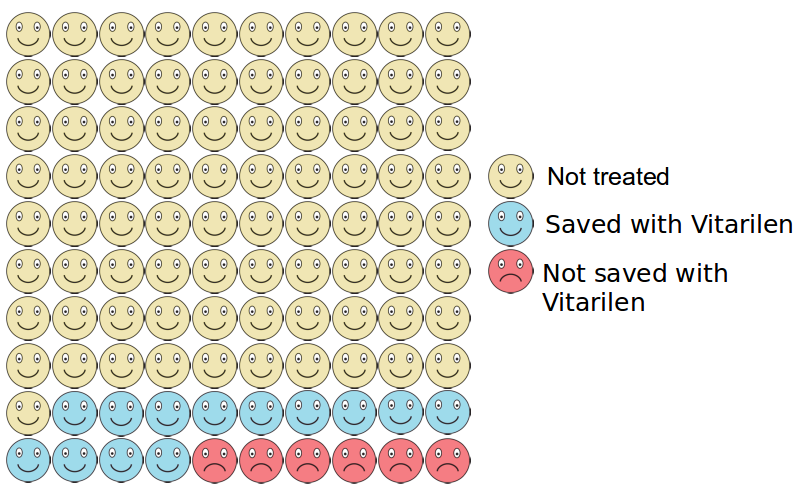
Figure 6.- Icon arrays are used to communicate treatment-risk reduction.
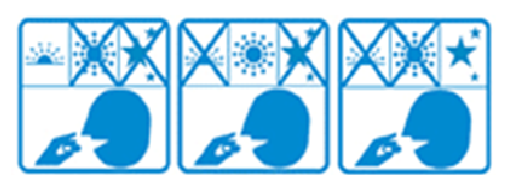
Figure 7.- Pictograms report dosage, timing, and action information about prescribed medications.
In our study of surgeons discussed above, visual aids increased the percentage of surgeons who correctly estimated the risk of a post-surgical side effect from 60% to 85%. The visual aids made the information more transparent by clarifying part-to-whole relations in the data, which helped the surgeons focus on the important information and eliminated differences in accuracy between those who were more and less numerate. We have observed even larger increases in accuracy of understanding of the effectiveness of medical treatments in probabilistic national samples from the United States and Germany (Garcia-Retamero & Galesic, 2010): The addition of visual aids helped groups of people with limited numeracy achieve an increase from 20% to 80% accuracy. Similar results can be found when communicating the efficacy of mammography screening for reducing breast cancer mortality (Petrova, Garcia-Retamero, & Cokely, 2015) and in studies of people from all around the world who have faced different kinds of risk-related issues (e.g., diagnostic inferences, assessing confidence, changing attitudes, forming behavioral intentions, and making decisions) (see Garcia-Retamero & Cokely, 2013, for a review).
Across these studies, transparent information formats that incorporate visual aids tend to provide the greatest benefits to those who are most vulnerable, including older adults, high-risk patients, people from diverse cultures, and people with low numeracy. The lesson from this body of research is clear: Better information formats can have profound effects on our ability to understand risks.
References
Galesic, M., & Garcia-Retamero, R. (2010). Statistical numeracy for health: A cross-cultural comparison with probabilistic national samples. Archives of Internal Medicine, 170, 462-468.
Garcia-Retamero, R., & Cokely, E. T. (2013). Communicating health risks with visual aids. Current Directions in Psychological Science, 22, 392-399.
Garcia-Retamero, R., & Cokely, E. T. (2014). Using visual aids to help people with low numeracy make better decisions. In B. L. Anderson, & J. Schulkin (Eds.), Numerical Reasoning in Judgments and Decision Making about Health. (pp. 153-174). Cambridge: Cambridge University Press.
Garcia-Retamero, R., Cokely, E. T., Wicki, B., & Joeris, A. (in press). Improving surgeons’ risk literacy with visual aids. Patient Education and Counseling.
Garcia-Retamero, R., & Galesic, M. (2010). Who profits from visual aids: Overcoming challenges in people’s understanding of risks. Social Science & Medicine, 70, 1019-1025.
Gigerenzer, G., Gaissmaier, W., Kurz-Milcke, E., Schwartz, L. M., & Woloshin, S. (2007). Helping doctors and patients make sense of health statistics. Psychological Science in the Public Interest, 8, 53-96.
Petrova, D. G., Garcia-Retamero, R., & Cokely, E. T. (2015). Understanding harms and benefits of cancer screening: A model of factors that shape informed decision making. Medical Decision Making, 35, 847-858.
Rodríguez, V., Andrade, A. D., Garcia-Retamero, R., Anam, R., Rodríguez, R., Lisigurski, M., . . . Ruiz, J. G. (2013). Health literacy, numeracy, and graphical literacy among veterans in primary care and their effect on shared decision making and trust in physicians. Journal of Health Communication, 18(sup1), 273-289.
Manuscript received on August 16th, 2016.
Accepted on October 10th, 2016.
This is the English version of
García-Retamero, R., y Petrova, D. (2017). Ayudas visuales simples aclaran los riesgos para la salud. Ciencia Cognitiva, 11:1, 1-4.
